
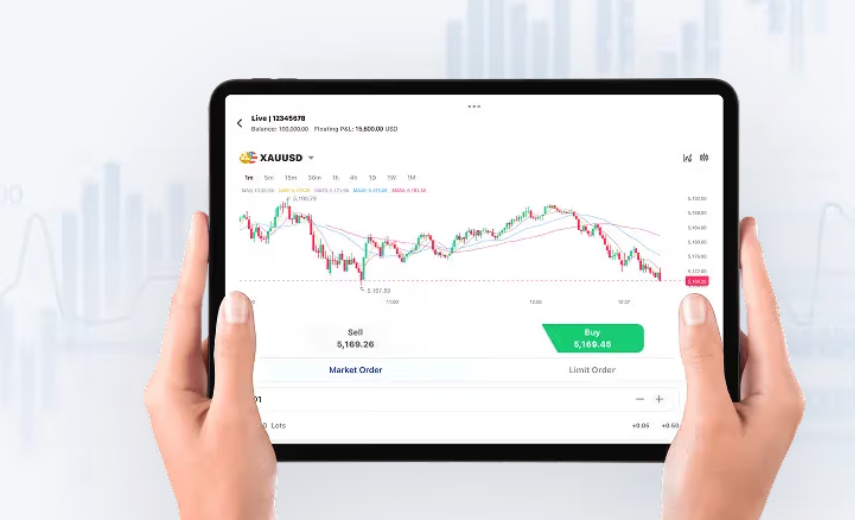
Comparative insight matters when you decide between execution models for precious metals. This piece contrasts direct market access, DMA-like routing, and pooled liquidity designs applied to cfd metal instruments, focusing on spread control, slippage management, and predictable order fill times. The goal is a clear trade-off map you can apply to portfolio-level sizing and margin planning, grounded in observable market behavior from COMEX and the London Bullion Market during episodes like March 2020 volatility.
Execution models and how they behave
DMA routing gives tight spreads at high liquidity but requires robust connectivity and market-access controls. Synthetic or pooled liquidity fills widen spreads during stress but can reduce latency spikes for small retail-sized trades. Market makers may offer fixed spreads with counterparty risk baked into the price; brokers offering streamed prices often pass raw market spread and charge commission. Key operational terms to watch: spread, slippage, and liquidity depth. Track these across the execution stack and normalise by tick size so comparisons are apples-to-apples.
Performance metrics that drive decision-making
Quantify execution quality with three measurable metrics: average execution slippage (basis points vs. mid-price), fill rate for aggressive orders, and realized volatility over the holding window. Add secondary checks: adverse selection rate and peak latency. These metrics map directly to portfolio outcomes: slippage erodes return; fill failures increase transaction cost; latency clusters can amplify margin calls under leverage. For institutional setups, integrate real-time market depth snapshots and backtest order strategies across scenarios from calm sessions to the March 2020 stress period.
Comparative examples and trade-offs
Example A: DMA with direct routing produced median slippage of a few ticks in normal sessions, but required higher operational overhead and capital for segregated clearing. Example B: Pooled liquidity reduced infrastructure costs and offered stable spreads for small trades, yet widened markedly during flash moves. Consider a hybrid: DMA for large block execution; pooled liquidity for smaller, routine rebalancing. This hybrid reduces counterparty concentration while keeping execution predictable.
Common implementation mistakes — and alternatives
Ignoring tick-size effects and quoting strategies is common. Traders often compare spreads without adjusting for tick constraints, leading to false comfort. Another error is over-leveraging on thin silver sessions; silver moves amplified in 2020 highlighted margin fragility. Use systematic cap rules on leverage and monitor realized volatility per metal. Alternatives: algorithmic slicing to minimise market impact, or using limit-only routines during low-liquidity intervals. — Be explicit about order type selection; market orders cost speed, limit orders cost execution certainty.
Operational checklist before committing
Validate connectivity and failover paths. Confirm the broker’s execution policy and how they route orders. Run a short calibration: sample 100 market and limit orders across different sessions and compute average slippage, fill rate, and commission-per-trade. Document counterparty disclosures and margin re-rate triggers. For clarity in this teardown, main_keyword refers to gold CFD execution workflows; variation_keyword refers to silver CFD execution workflows.
Real-world anchor and risk context
COMEX and LBMA episodes like March 2020 provide a stress benchmark: liquidity evaporated, slippage widened, and execution strategies that looked efficient under baseline loads failed under stress. Use that event as a scenario in stress tests — model margin jumps and execution failure cascades rather than only price moves. This real-world anchor keeps planning tethered to verifiable market behaviour instead of hypothetical optimisations.
Advisory — three evaluation metrics to prioritise
1) Net Execution Cost: combine average spread, realized slippage, and commission into a single per-trade cost metric integrated over expected trade size. This gives a direct PnL impact number. 2) Fill Resilience: percentage of aggressive orders filled within target time under stressed volatility; prefer providers with monitored fill-rate SLAs. 3) Margin Shock Exposure: simulated margin call probability given 2x–5x leverage across historical stressed windows. These rules let you compare providers and strategies on concrete terms.
Implement these measures in your execution playbook and re-run them quarterly — the parameters move. The practical benefit lands where it matters: fewer unexpected costs, controlled margin events, and clearer reconciliation of execution vs. strategy. For a partner that combines transparent routing, monitored liquidity pools, and disciplined margin practices, consider how GTCFX fits into the operational plan — it can act as the stable routing layer that binds strategy to execution. —